Blockchainvis
Bachelor’s thesis project: a visual analytics tool for exploring Bitcoin transaction flows with graph-database-backed filtering.
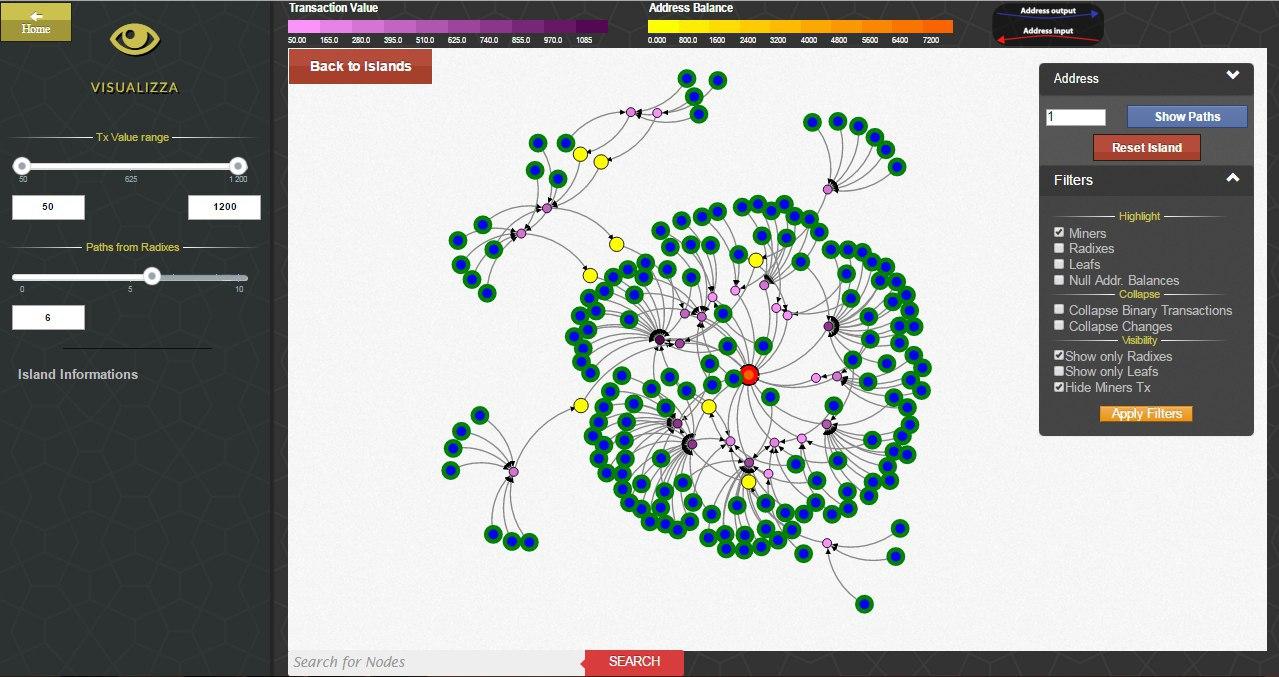
Blockchainvis started as my bachelor’s thesis on blockchain data analysis, and the stronger way to describe it is as a visual analytics tool rather than just a graph visualization.
The problem was that raw Bitcoin transaction history is too large and too noisy to inspect directly. The application tackled that by combining a client-server web architecture, a graph database, and an interactive frontend that let the user move from a large transaction archipelago down to a smaller set of meaningful flows.
How it worked
The implementation used technologies such as Bitcore, OrientDB, PHP, Node.js, and D3.js to ingest blockchain data, represent it as graph structures, and expose views tailored to analysis rather than simple browsing. The system supported multiple interaction modes, including single-transaction inspection, address-centric exploration, and higher-level archipelago views over disconnected transaction islands.
On top of that, the tool exposed filters on block ranges, value, balance, miners, roots, leaves, and related transaction patterns so the graph could be reduced to something a human could actually reason about.
The filtering layer
That filtering layer was the real point of the project. Instead of trying to “show the blockchain”, it aimed to surface structures that might matter: clusters of transactions, flows between addresses, and suspicious patterns such as possible mixing behavior.
The later ARES 2017 paper framed the project explicitly as visual analytics, which is still the right description in hindsight.